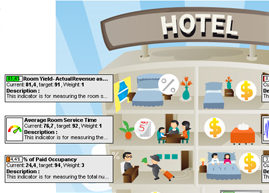
We have released info-graphic project for Hotel KPIs. Click on the screenshot below to get an idea about how it looks like. It is not just info-graphic, indicators that you see on the picture are live, so in BSC Designer you can update values of indicator and they will change their values on the strategy map.
- Important: to use info-graphic you will need BSC Designer PRO (trial or full version);

Click on Hotel KPI info-graphic to enlarge
How to try this live Hotel KPI info-graphic:
- Get BSC Designer PRO. Download and install BSC Designer PRO. Open “C:\program files\BSC Designer\Samples” folder. You will find there “hotel-info-graphic.bsc” file.
- Go to the Strategy map tab and you will see this info-graphic!
- This info-graphic already includes 16 KPIs for Hotel contributed by WinningKPI.com
What you can do with KPIs and info-graphic:
- You can double click on any indicator and BSC Designer will switch you to KPI Tree tab where this indicator will be selected for editing.
- Indicators on the map can be moved. BSC Designer understands where to place indicators according to map marks.
- Also, as you have noticed indicators have various visual style, so are gauge diagram, so are progress bar, some are like performance chart. You can customize this by selecting indicator and changing Glyph property (in older version named Performance).
- If you need smaller indicators then use “Compact mode” property.
- Finally, export info-graphic as an image (menu Strategy map -> Export) or you can create various reports (see Reports menu).
Who benefits from Hotel info-graphic:
- Info-graphic is recognized as a powerful visualization tool;
- Top-managers use info-graphic to improve their presentation;
- Info-graphic is a great way to communicate business-critical information;